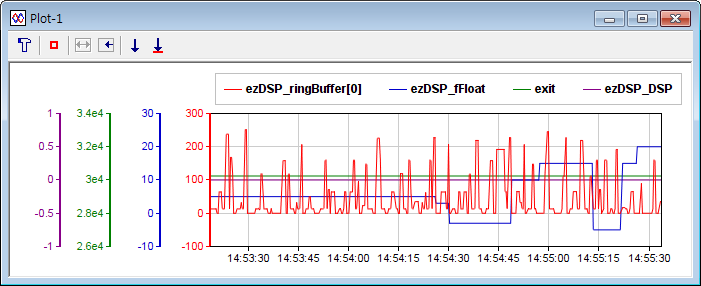
This
window plots the value of variables in real-time and saves its data for some
time. If the dynamics of the variable is rather slower than the sampling
interval, this window will act as an recorder. If the user's PC has
sufficient memory, up to 4,294,967,295 data points per variable can be displayed
and saved. The integer variable with Q-format is displayed as it is float type.
For example, 32bit integer variable with Q31 format is displayed within 1 and
-1. You can use up to 15 Plot windows and single Plot2 window.
The
Plot window supports a minimum sampling period of 15ms, while the Plot2 window
supports 2ms; therefore, use Plot2 for variables requiring fast updates.
However, the entered sampling period may not be fully achieved depending on your
operating environment, such as variable byte size, total number of variables,
communication speed, and user PC or MCU resources. Please verify the actual
sampling period in the CSV file where the sampled data is saved. When the Plot2
window runs, all other windows except the Command window stop updating to
allocate all communication resources between easyDSP and the MCU to the Plot2
window.
Toolbar
: Configure the variables to be displayed and other related information.
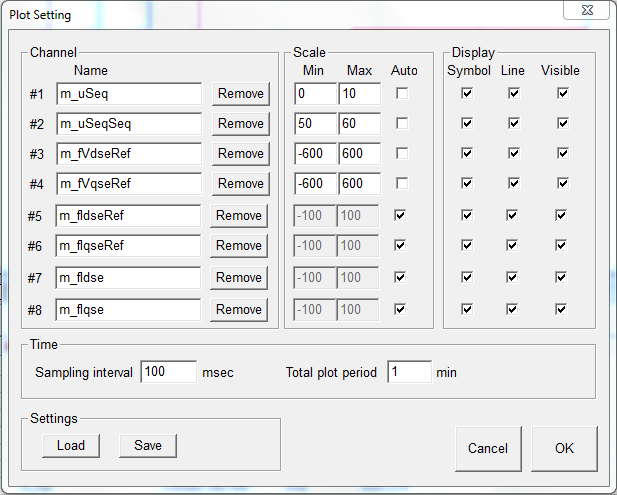
In the dialog box, you can set the variable name, the minimum/maximum/auto values of the Y-axis display range, or the display mode.
The system reads the registered variables at the specified sampling interval and displays them as a graph for up to the total plot period.
The setting can be saved to and loaded from the file by clicking 'Save'/'Load' button.
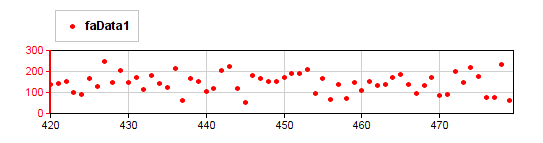
The colors and symbols are predefined as follows.
channel #1 : red - circle
channel #2 : blue - square
channel #3 : green - triangle
channel #4 : violet - diamond
channel #5 : black - right triangle
channel #6 : weak green - left triangle
channel #7 : grey - '+' shape
channel #8 : orange - 'x' shape

(toggled) : pauses graph / resumes graph.
: shows all graph data. Its shows all the data stored in memory allocated to support 'Total plot period'.
: shows recent data. It shows the latest data fitting to current plot window size.
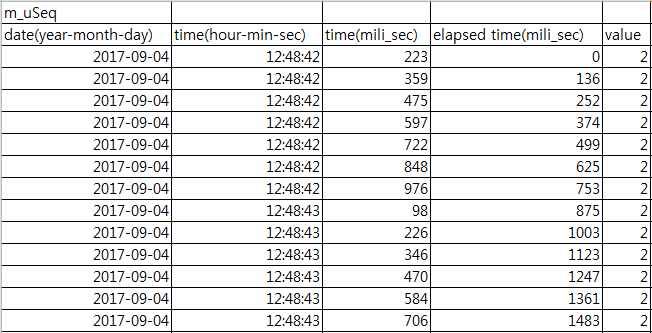
: saves the graph into graphic file (bmp, jpg, png formats) or save the graph data into text file (csv format as shown below).
: saves the graph data to record file (file extension = rec). You can open the record file with record window.
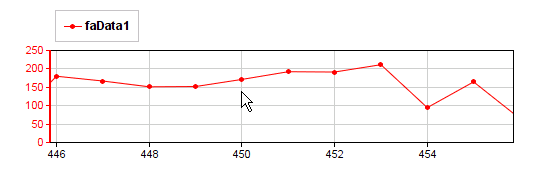
- Tooltip function : The data value at the mouse cursor position will be displayed with small box
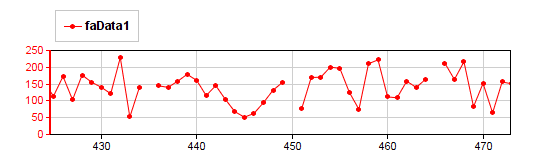
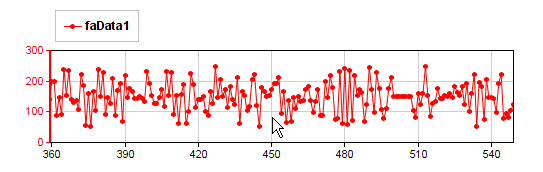
- If the communication failed with MCU, the corresponding data point is not displayed at all. As shown below, the line looks broken.
Same when the user intentionally pauses the communication.
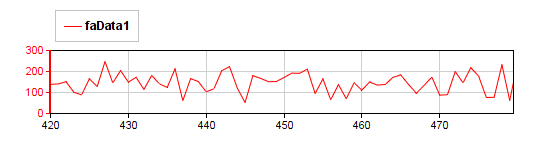
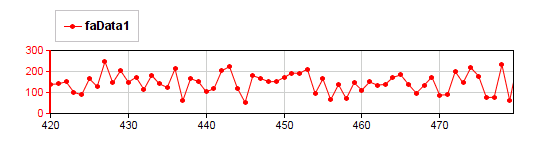
- Versatile line display mode by selecting symbol/line/visibility.
- X-axis zoom in/out possible with mouse wheeling.
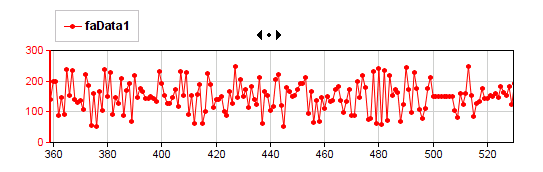
- Screen dragging is possible in X-axis direction by dragging mouse. (mouse cursor has special shape in this mode)